rnorm(10) # draw 10 random values from a Standard Normal distribution [1] 0.63285715 -0.09089180 0.05989258 -1.98495842 -1.39771385 -1.76343919
[7] -1.37670755 -0.97808745 0.72135449 0.59570175Mainstream in academia for statistical computing and data science, increasingly used in business. Job market advantage!
Free & open-source: wherever you go, R will be with you at no costs (unlike MATLAB, MPLUS, SPSS, etc.)
Real programming language: difficult at the beginning, but: 1) gives you lots of flexibility; 2) has transfer on other programming languages (e.g., Python).
Vast community support thanks to a large and active community (plus chatGPT, Gemini, Lucrez-IA, etc., know it pretty well!).
Huge ecosystem, >23,000 packages on CRAN, more from other sources (e.g., GitHub), to do amazing stuff with statistical data analysis, machine learning, data visualization, developing webapps [shiny], writing reports and even entire books [bookdown, rmarkdown]); also, can integrate with Quarto, GitHub.
Facilitates reproducible scientific research by sharing code and workflows.
Executing fundamental operations and using basic functions;
Working with essential data types and structures;
Gaining some proficiency in managing and manipulating data with vectors and dataframes;
Understanding some fundamental concepts of programming.
Core statistical inference methods;
LM/LMM/GLMM: (Generalized) linear (mixed-effects) models;
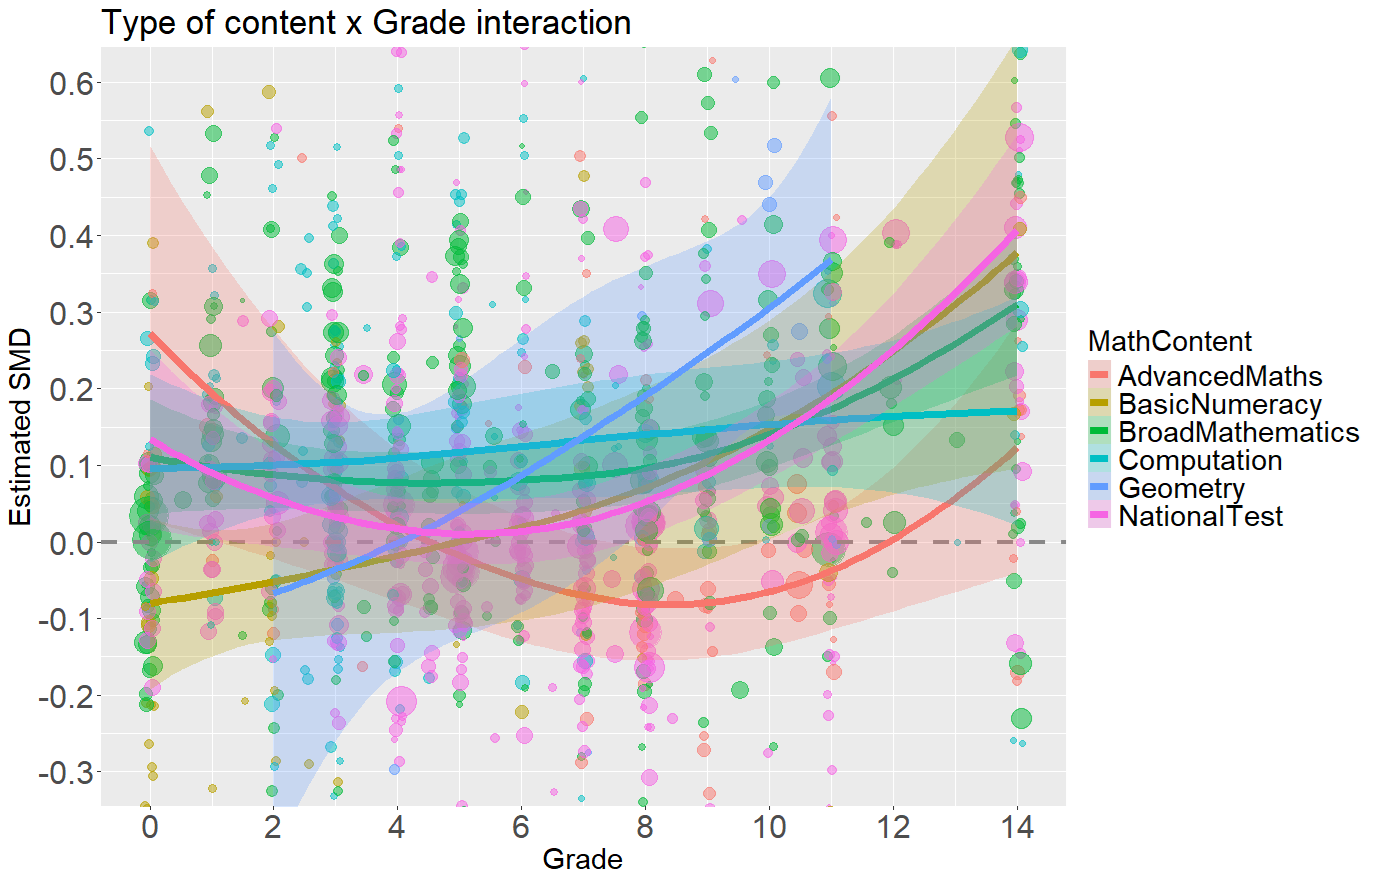
Data visualization using ggplot2;
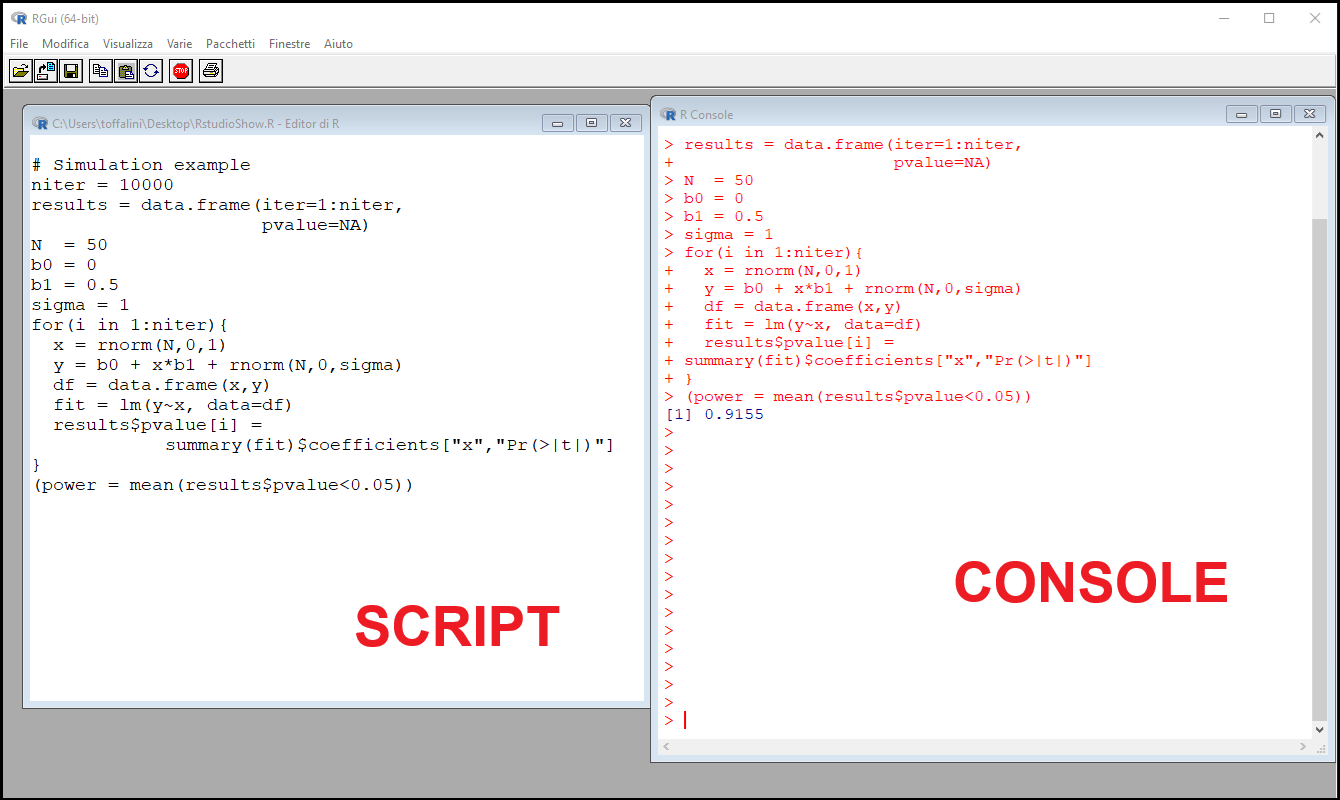
Power analysis & more via data simulation;
SEM: Structural Equation Modeling;
Conducting meta-analysis.
see Shiny gallery
here’s a couple of recent real examples from Psicostat members:
this game-like shiny app developed for the science4all event in Padova; see here some explanation in Italian
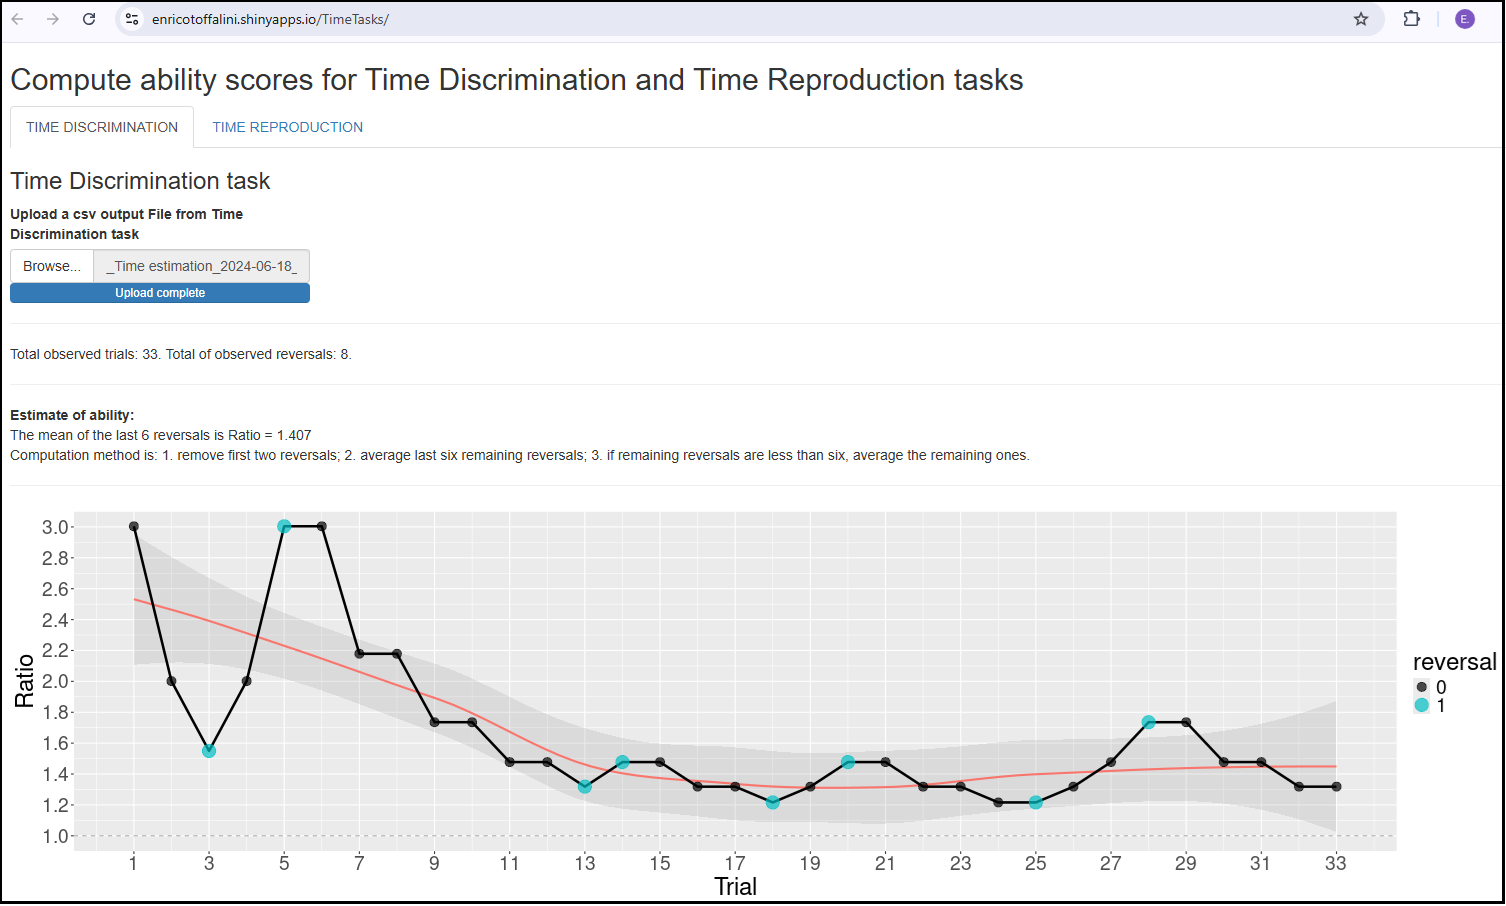
practical ad-hoc shiny app for scoring experimental data collected by students
examples of other resources that can be created within the R ecosystem, integrating other tools such as GitHub and Quarto:
this very course support material is a website in its own right
this very course textbook is a book/website
this book by Daniël Lakens explaining Statistical Inference
Make sure you install:
Interesting alternatives to installing RStudio:
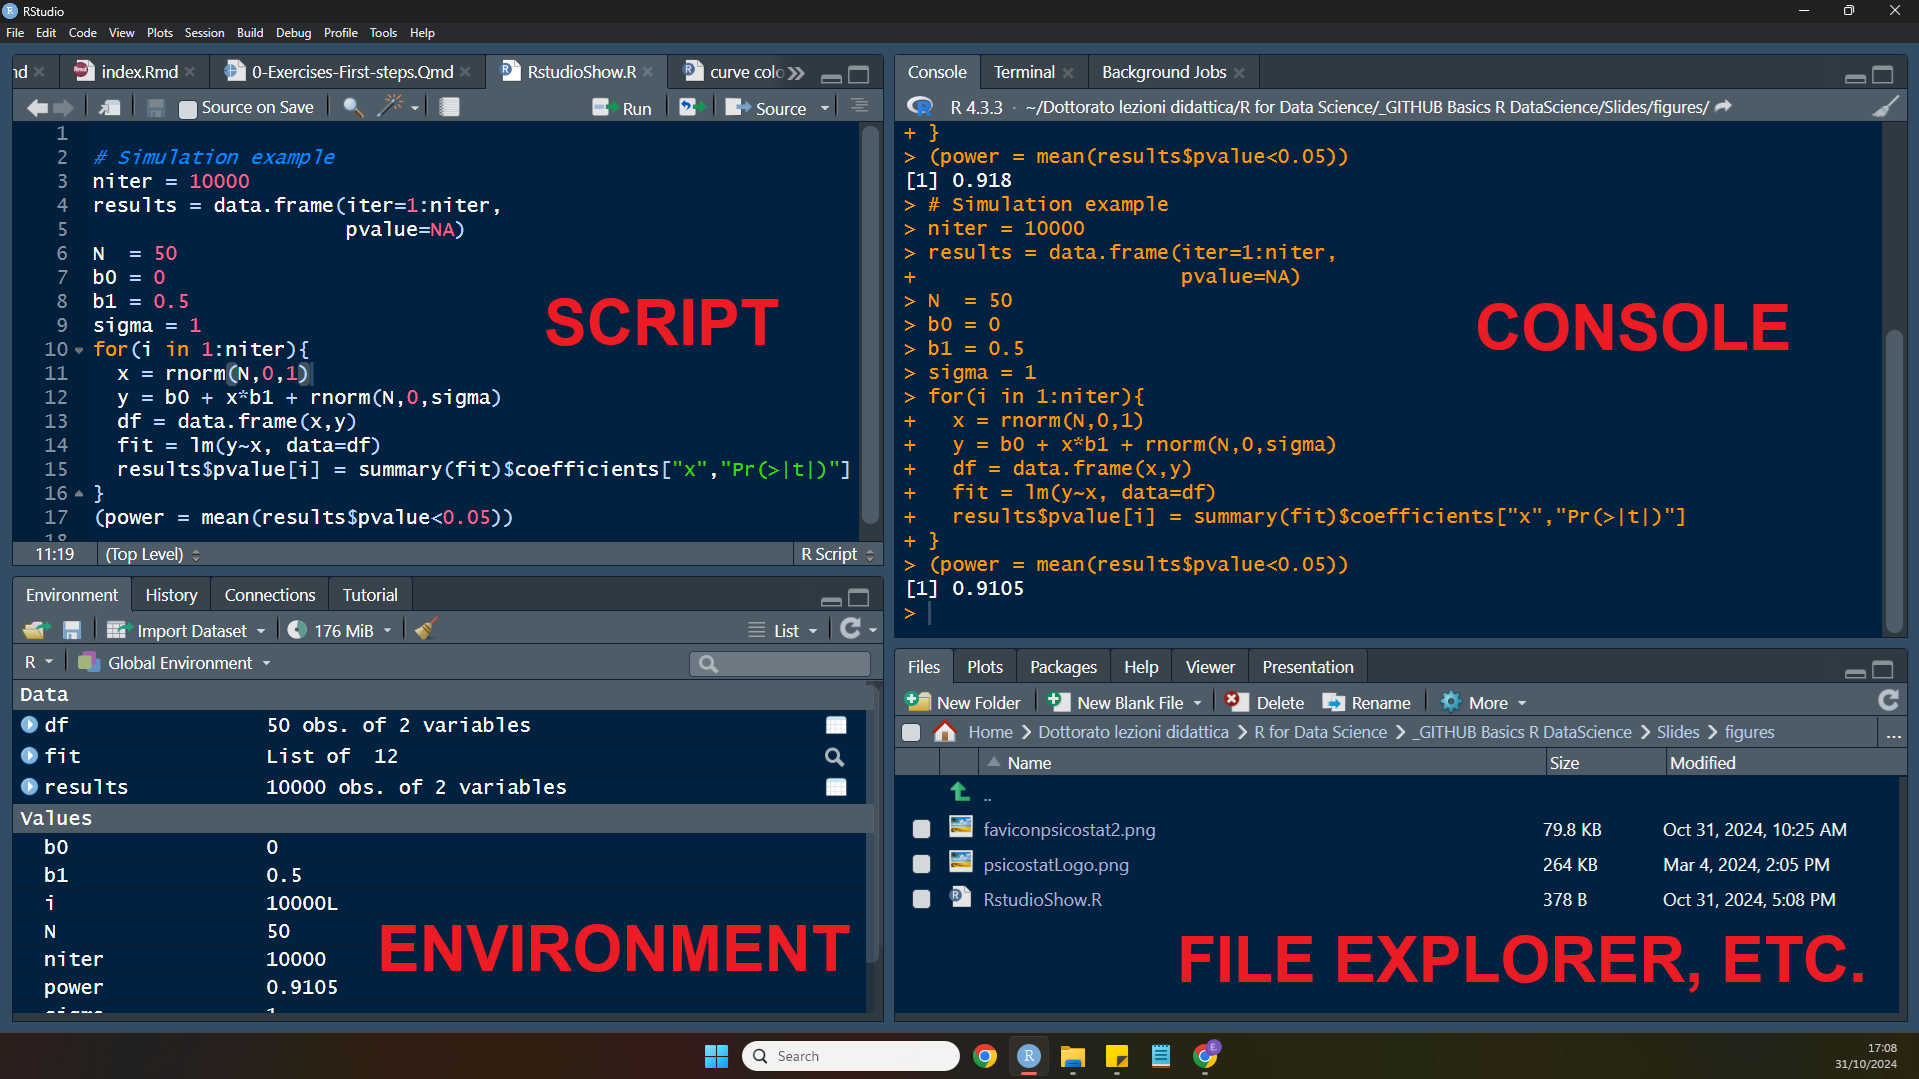
Let’s run a few commands in RStudio to familiarize with its console and see if the installation works properly
 [1]  0.63285715 -0.09089180  0.05989258 -1.98495842 -1.39771385 -1.76343919
[7] -1.37670755 -0.97808745 0.72135449 0.59570175 [1] 108 103 81 89 101 121 100 104 97 101