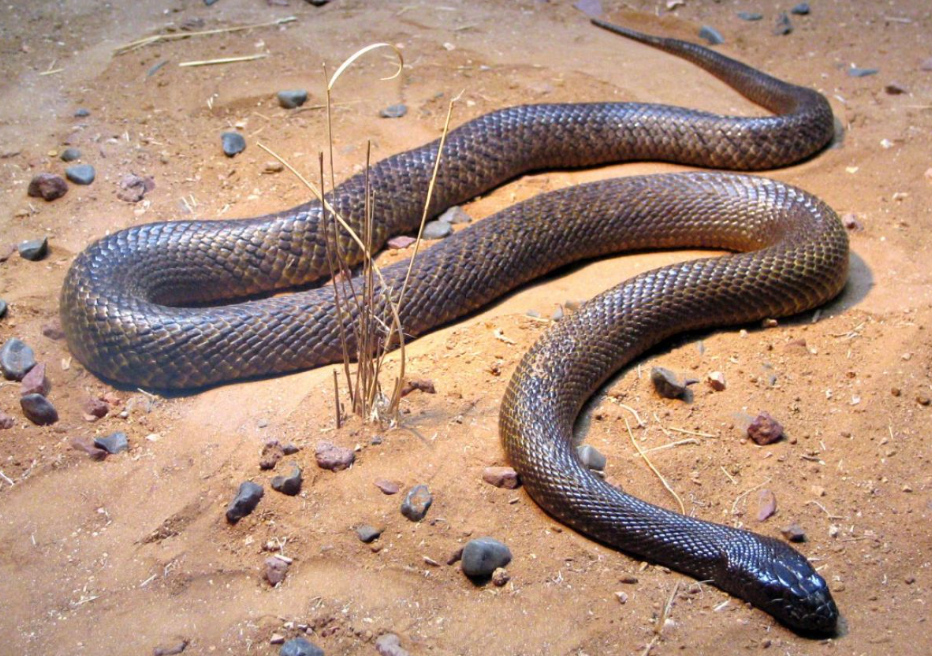
                                        label  score
                                  water snake 0.2936
                      Indian cobra, Naja naja 0.2809
ringneck snake, ring-necked snake, ring snake 0.1630
thunder snake, worm snake, Carphophis amoenus 0.1213
hognose snake, puff adder, sand viper 0.0520Intro to This Course, aka Why We Should Use Python
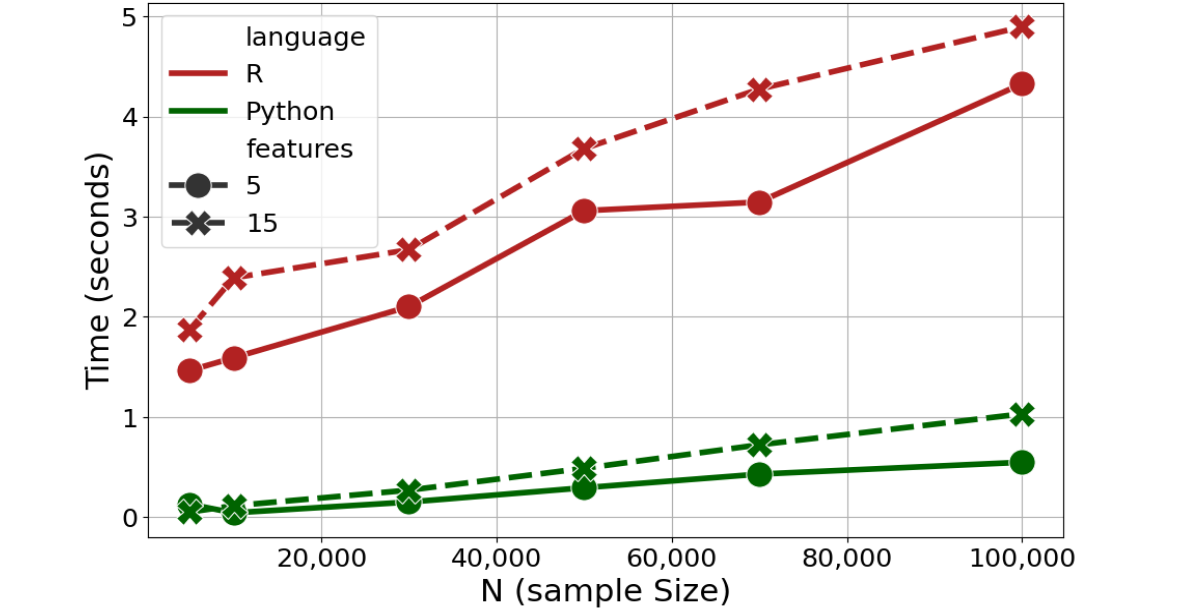
Python vs R Efficiency: Logistic Regression
Some explanation (click to expand)
For R the baseglm() function was used; for Python LogisticRegression() from the sklearn.linear_model module was used
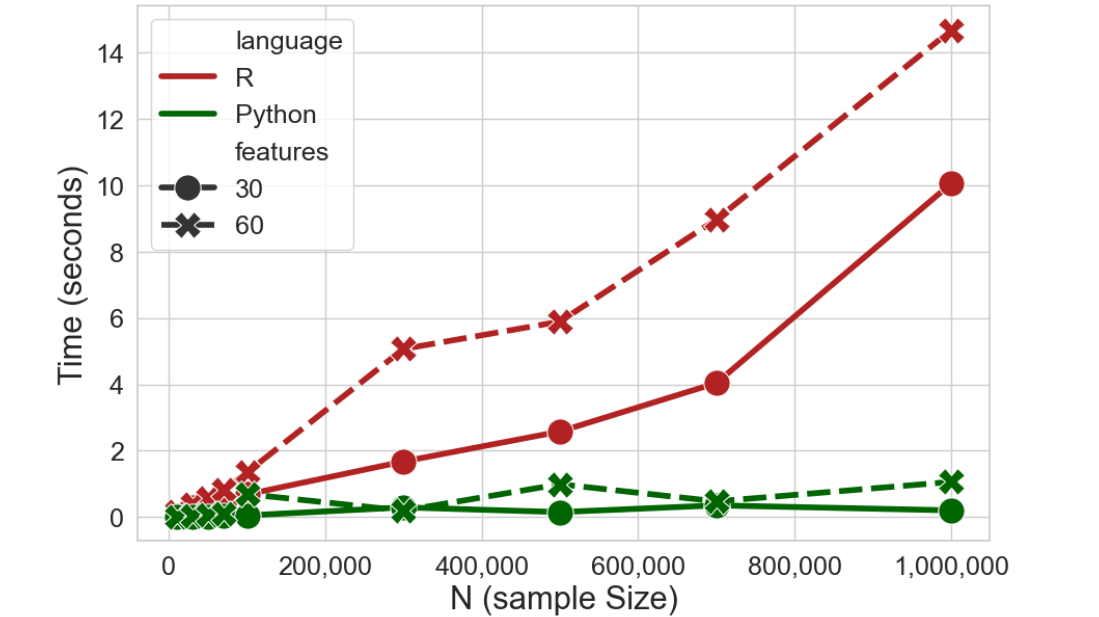
Python vs R Efficiency: GMM
Some explanation (click to expand)
Gaussian Mixture Models is a type of model-based clustering; for RMclusts() from the mclust package was used; for Python GaussianMixture() from the sklearn.mixture module was used
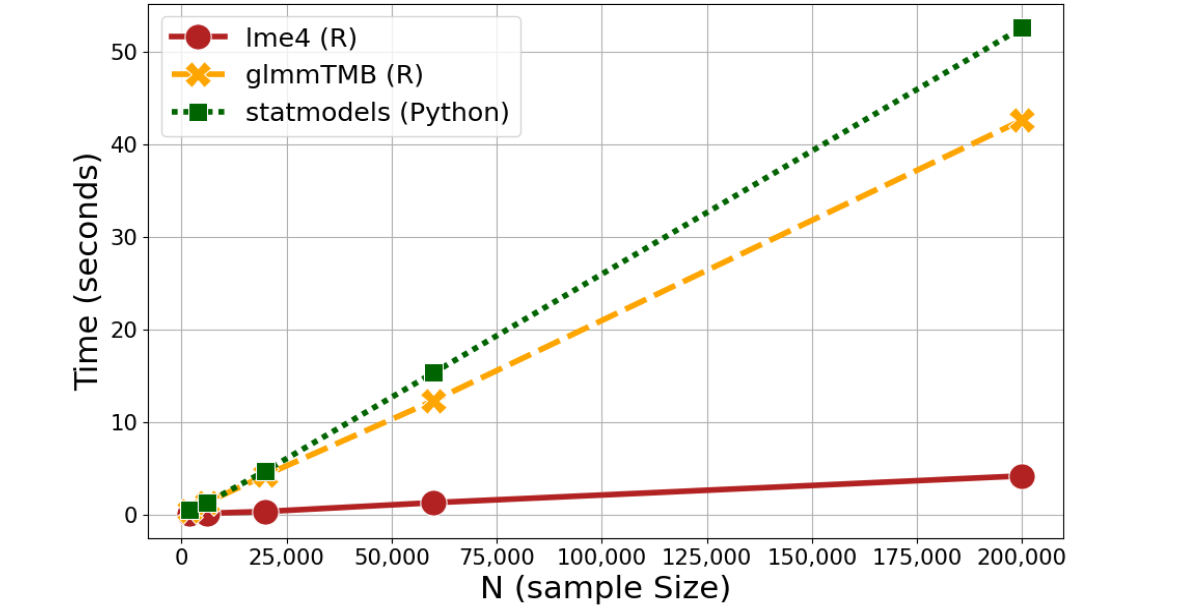
Python vs R Efficiency: Mixed-effects models
Some explanation (click to expand)
For R,lmer() and glmmTMB() from the lme4 and glmmTMB packages were used; for Python mixedlm() from the statsmodels.formula submodule was used
Python vs R Efficiency: Mixed-effects models
Some explanation (click to expand)
Each blue dot is a model with a randomly defined complexity (from 1 to 15 terms, both fixed and random, ranging from main effects to 4-way interactions)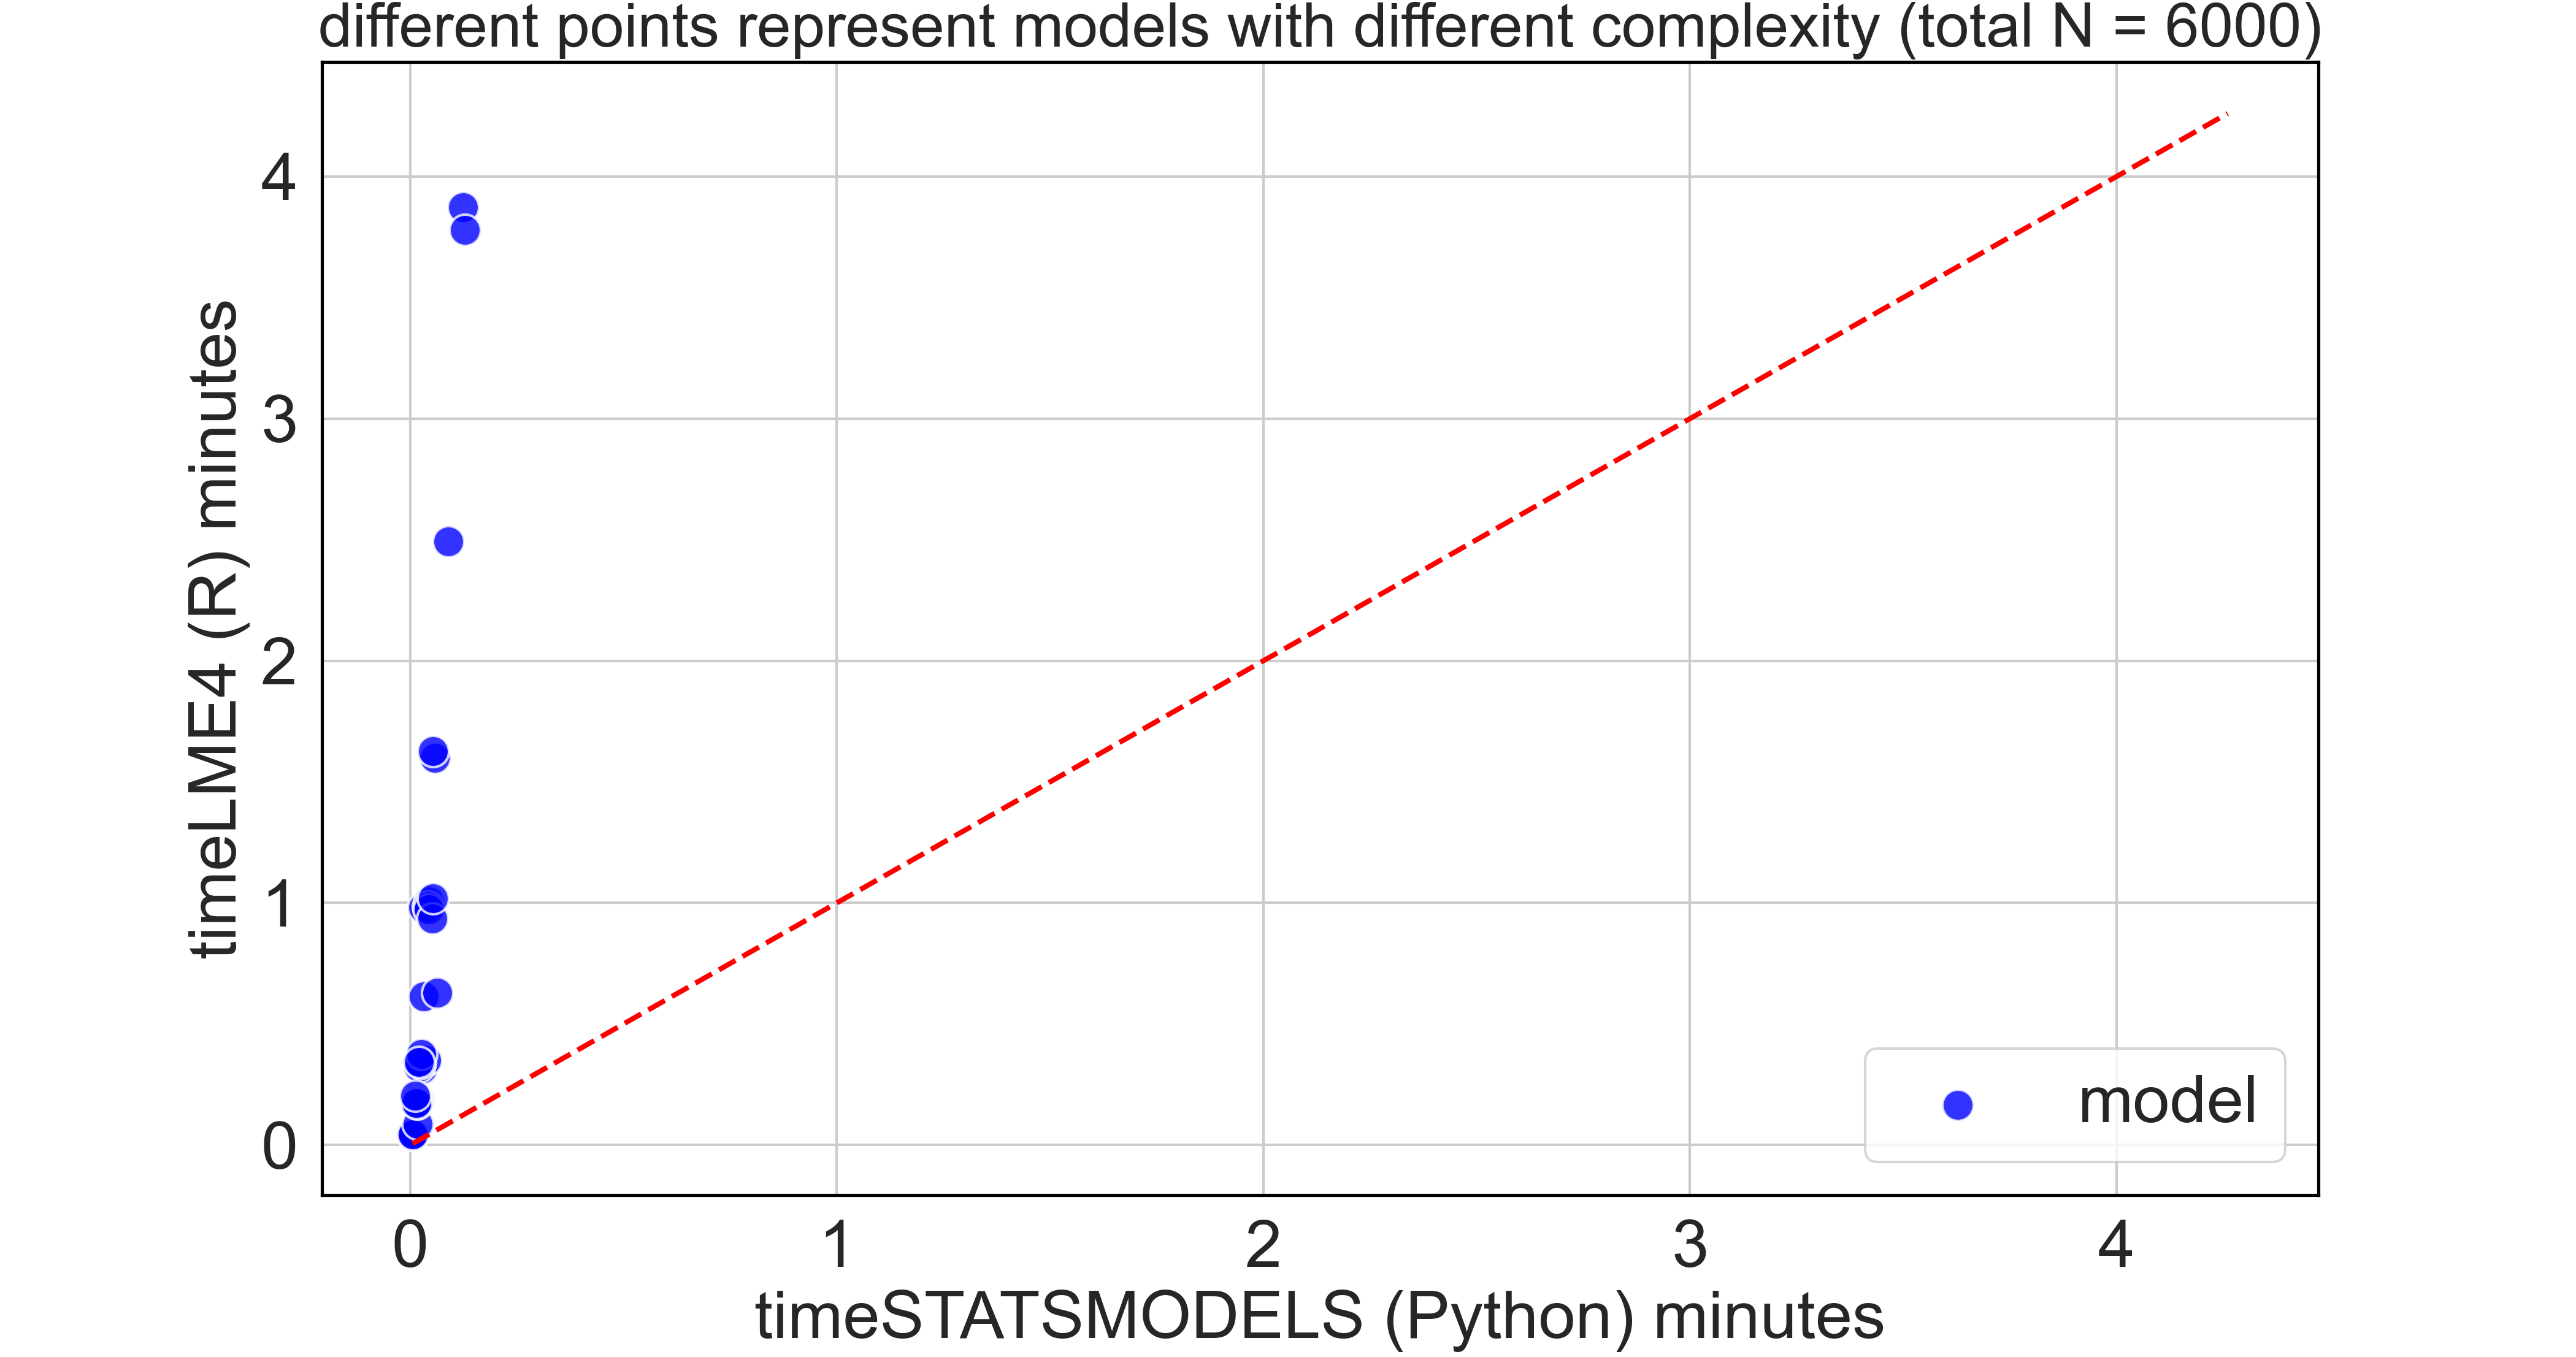
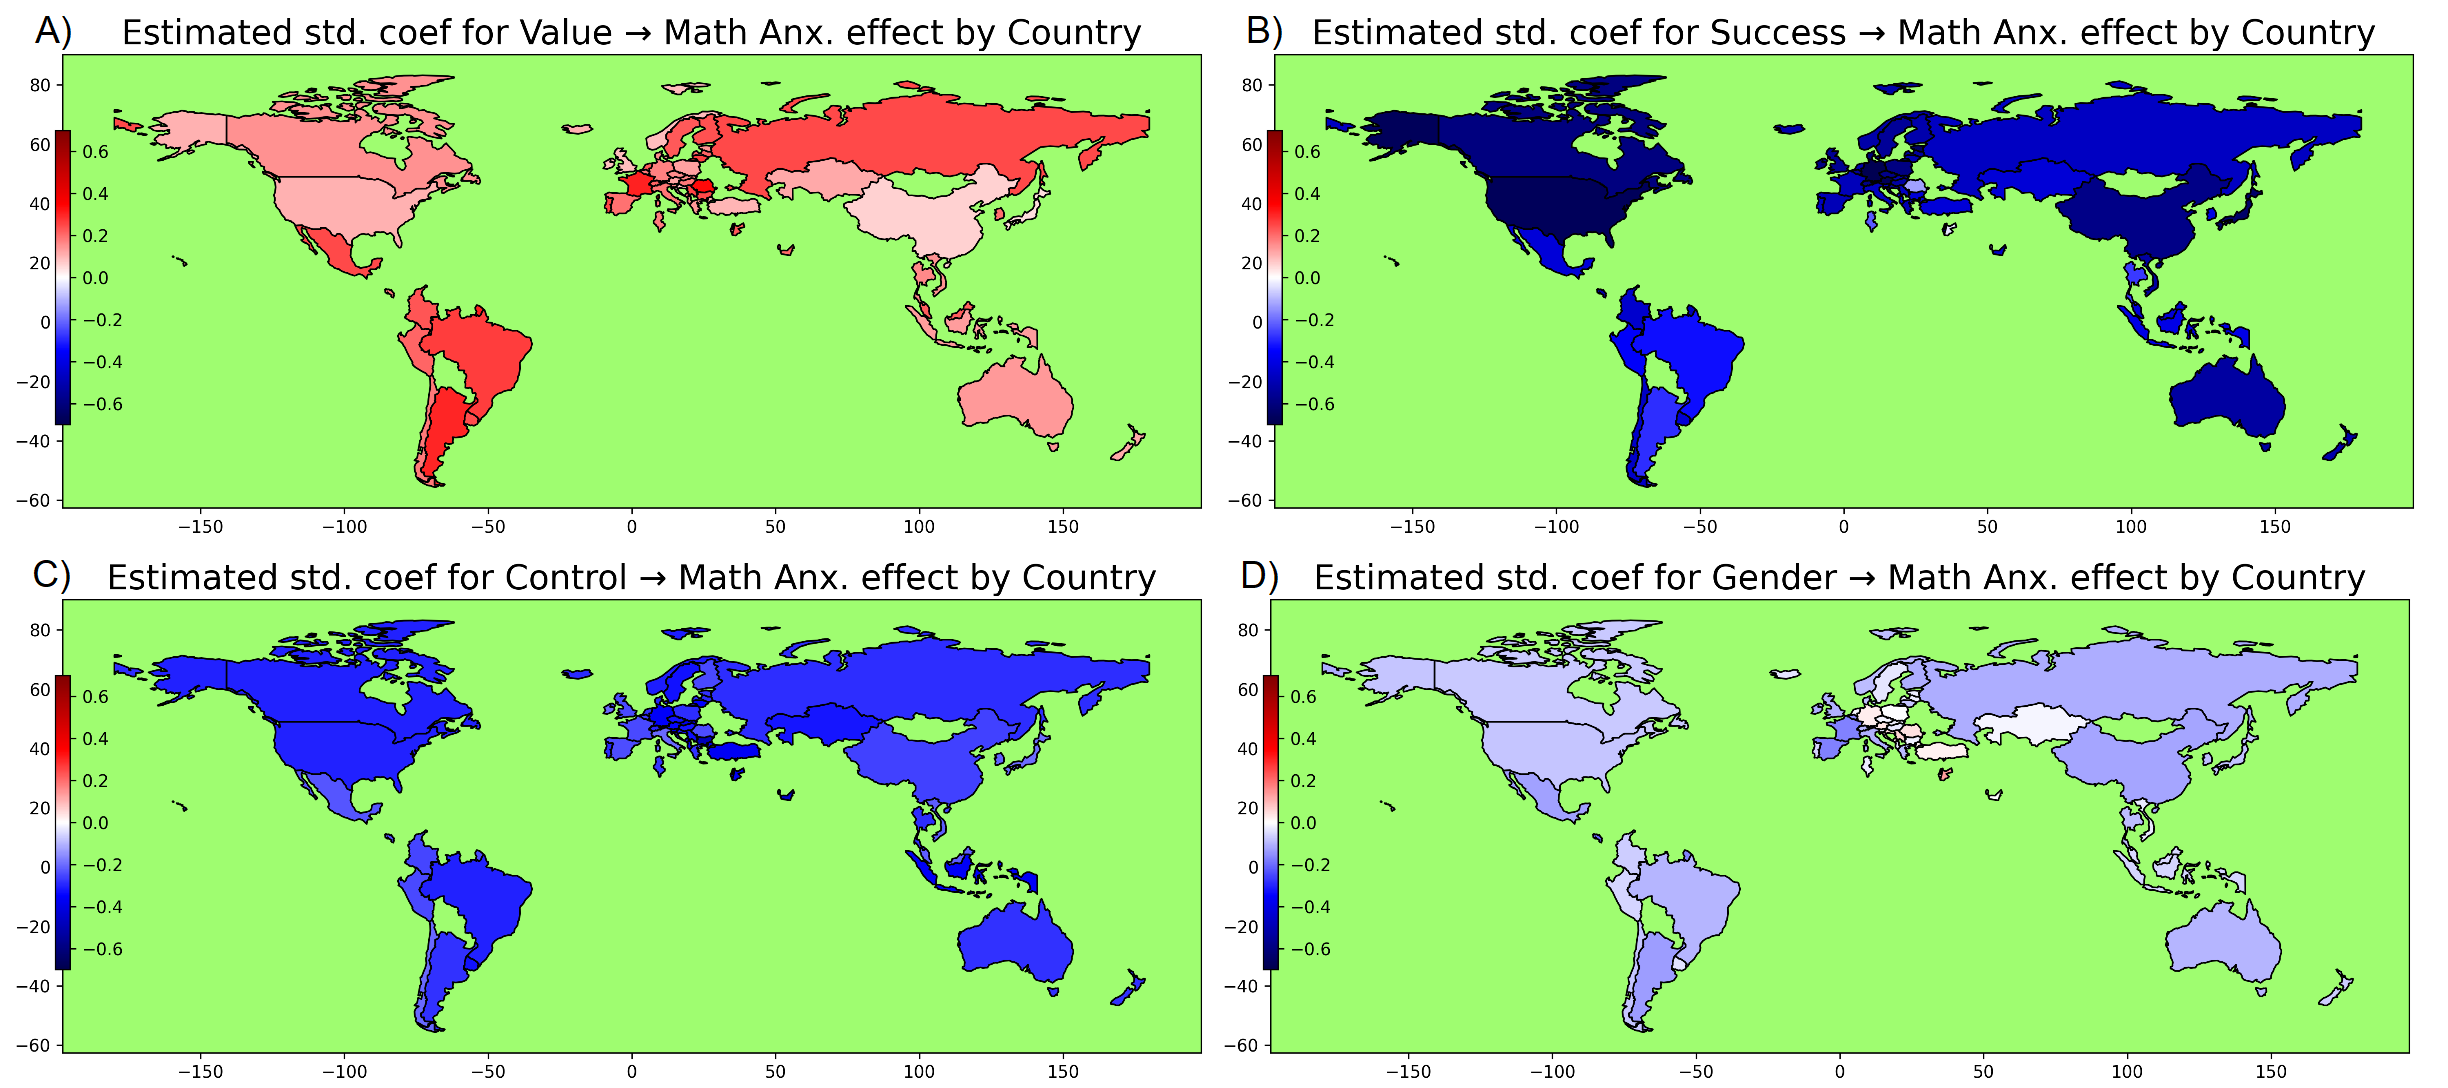
Data visualization with seaborn
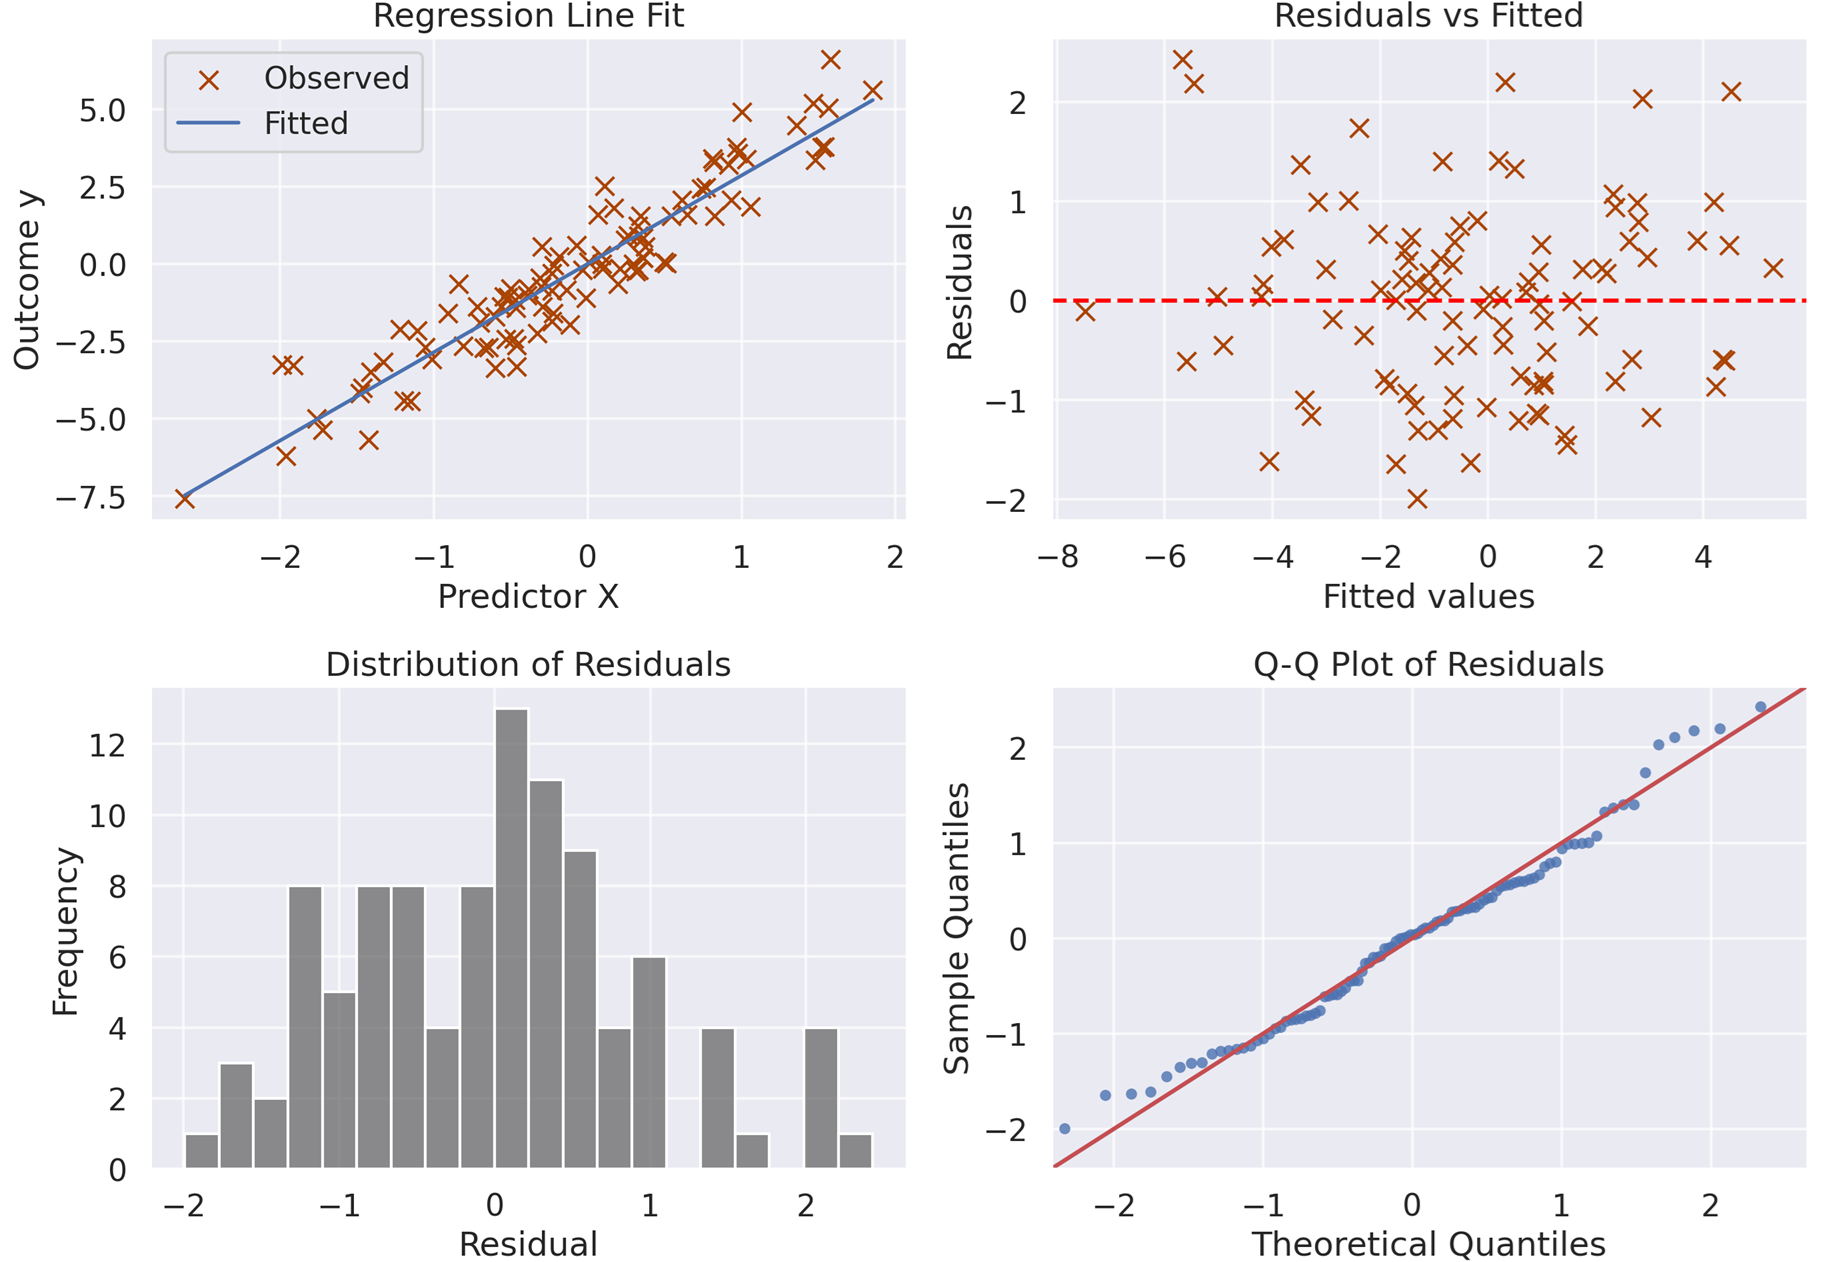
Data visualization with matplotlib
Shiny app with Python
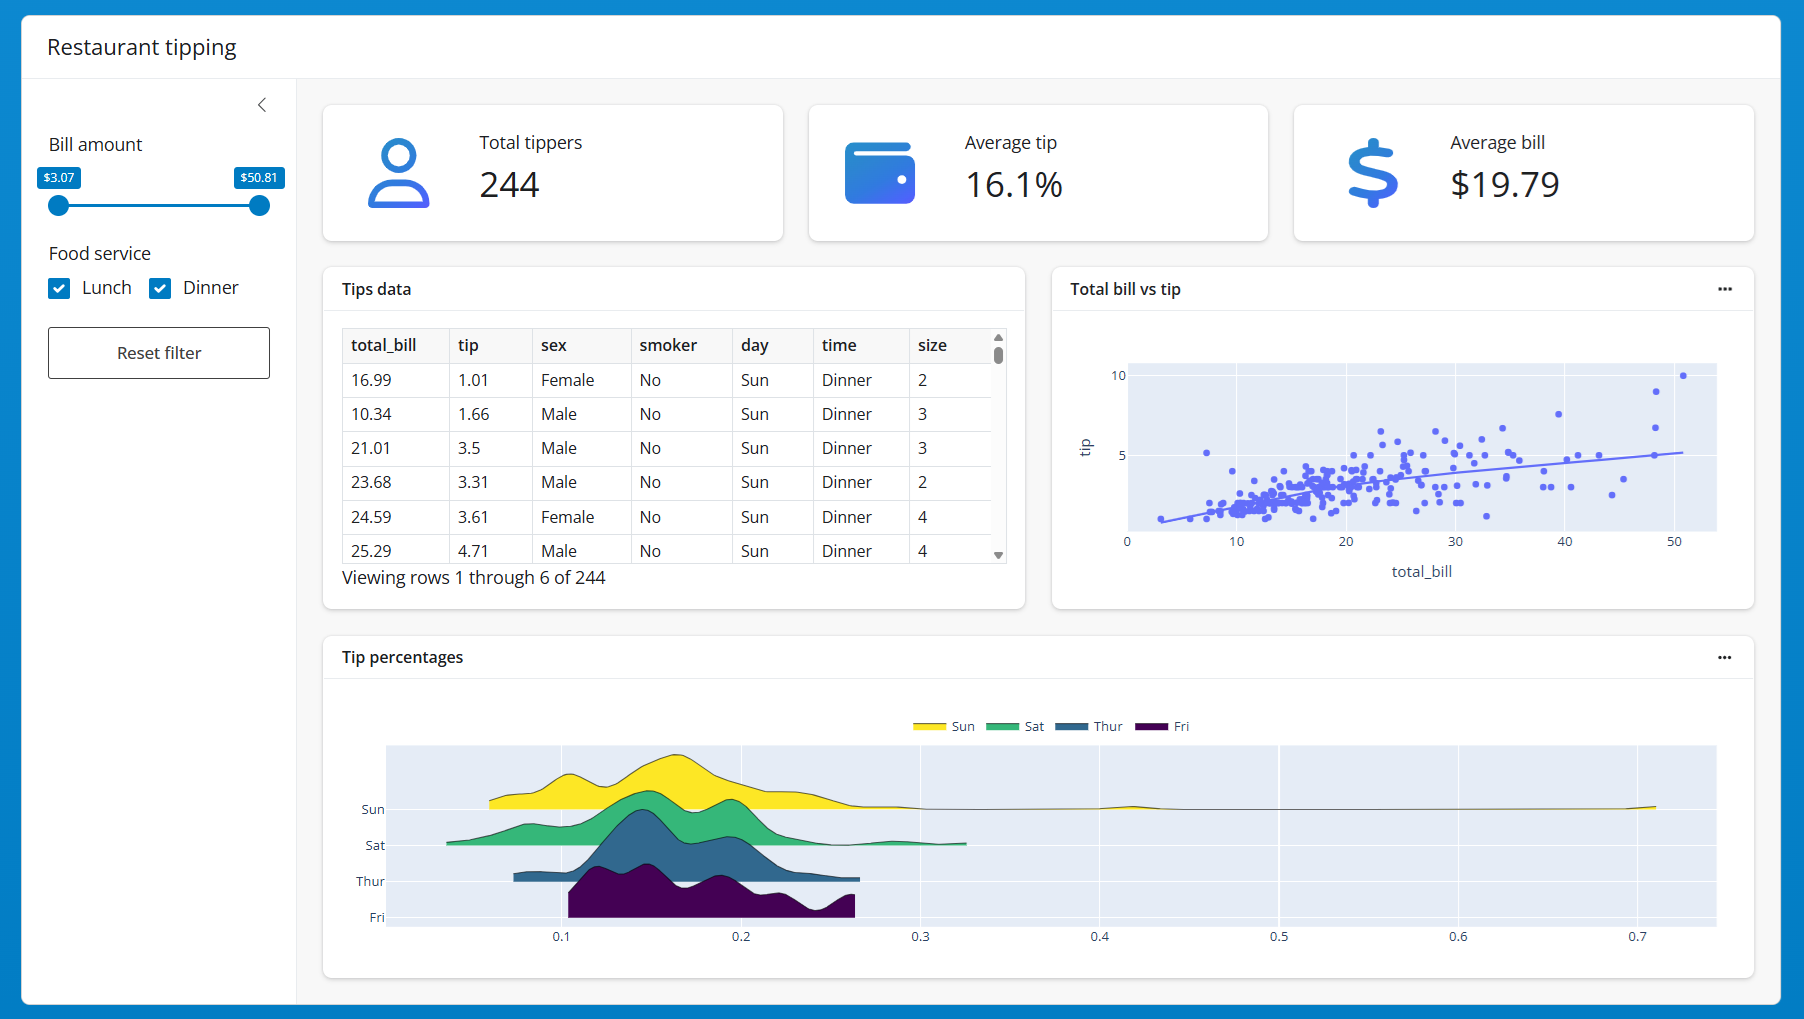
Streamlit: lightweight web app framework for Python
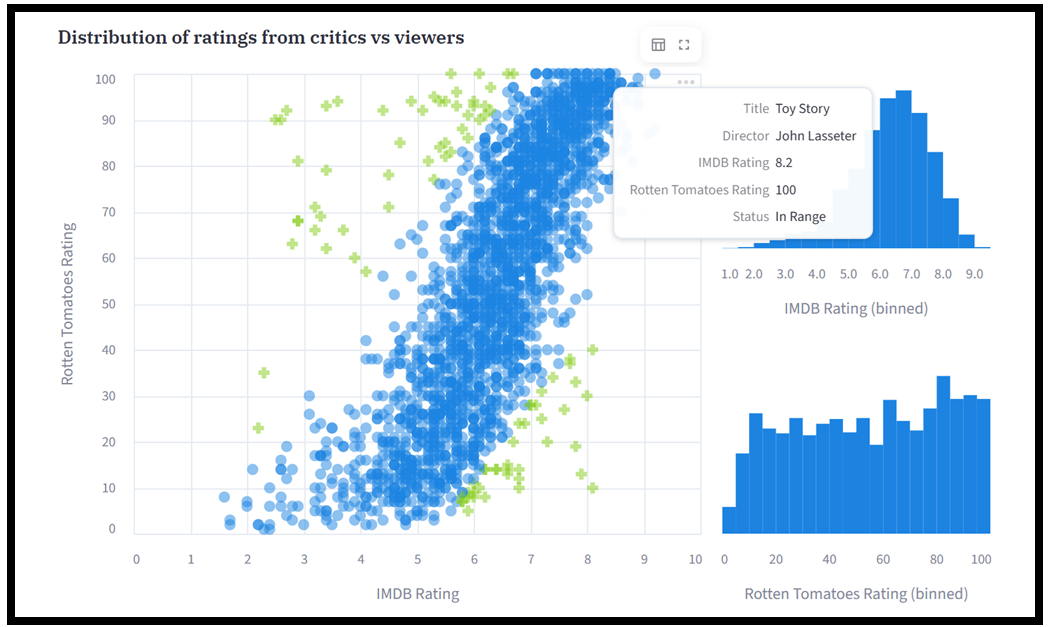
Image Classification with AI models via transformers
free model used: "microsoft/resnet-18"
Image Classification with AI models via transformers

free model used: "microsoft/resnet-18"
                                             label     score
                                        comic book  0.997275

book jacket, dust cover, dust jacket, dust wrapper  0.000718
                                     jigsaw puzzle  0.000567
                                 puck, hockey puck  0.000383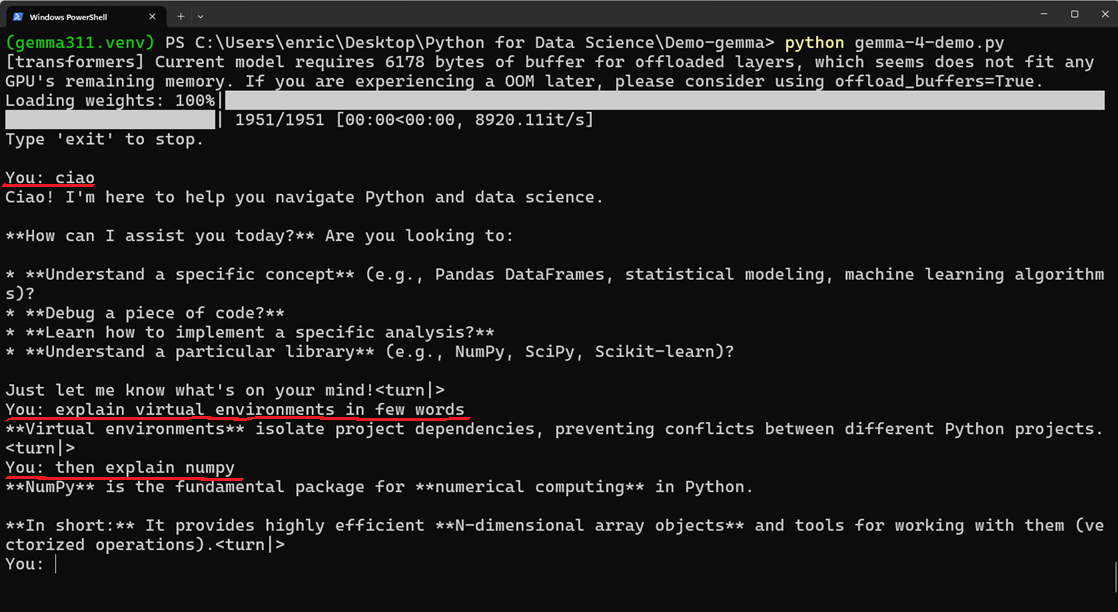
coffee mug 0.00014A locally running chatbot with Google’s Gemma4
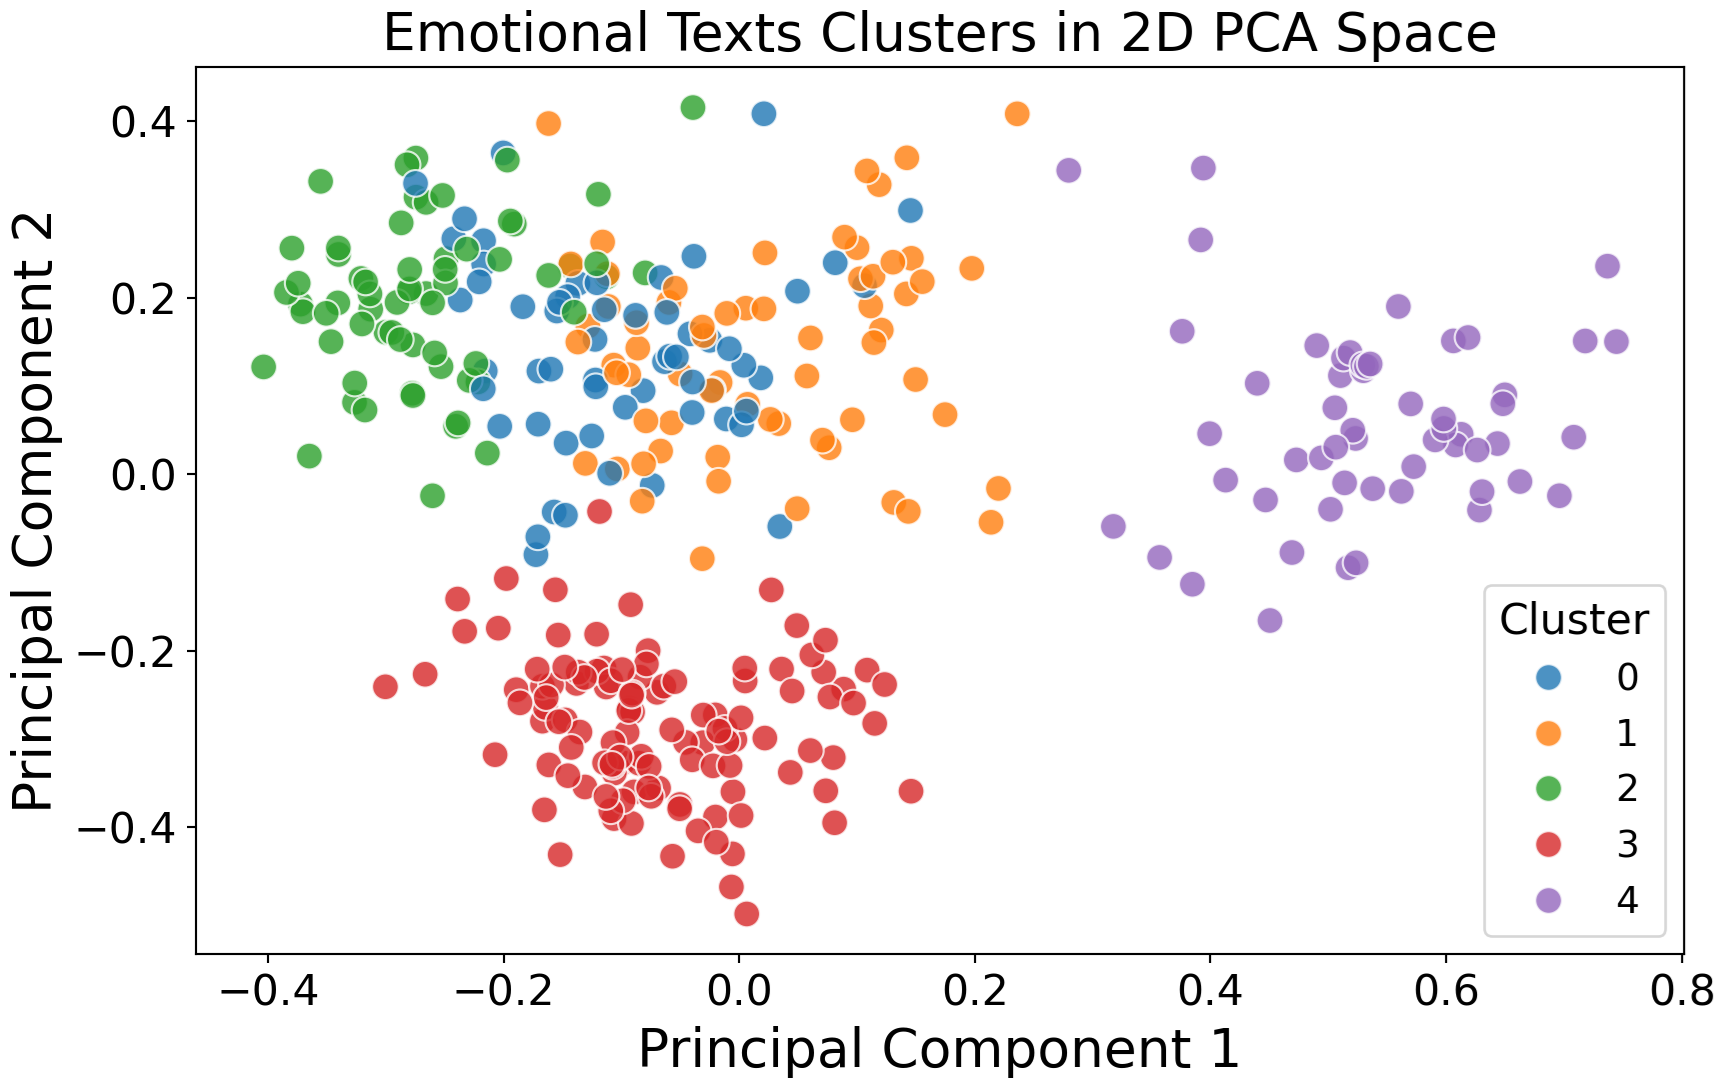
Working with semantic embeddings using LLMs (extracted with OpenAI’s text-embedding-ada-002)
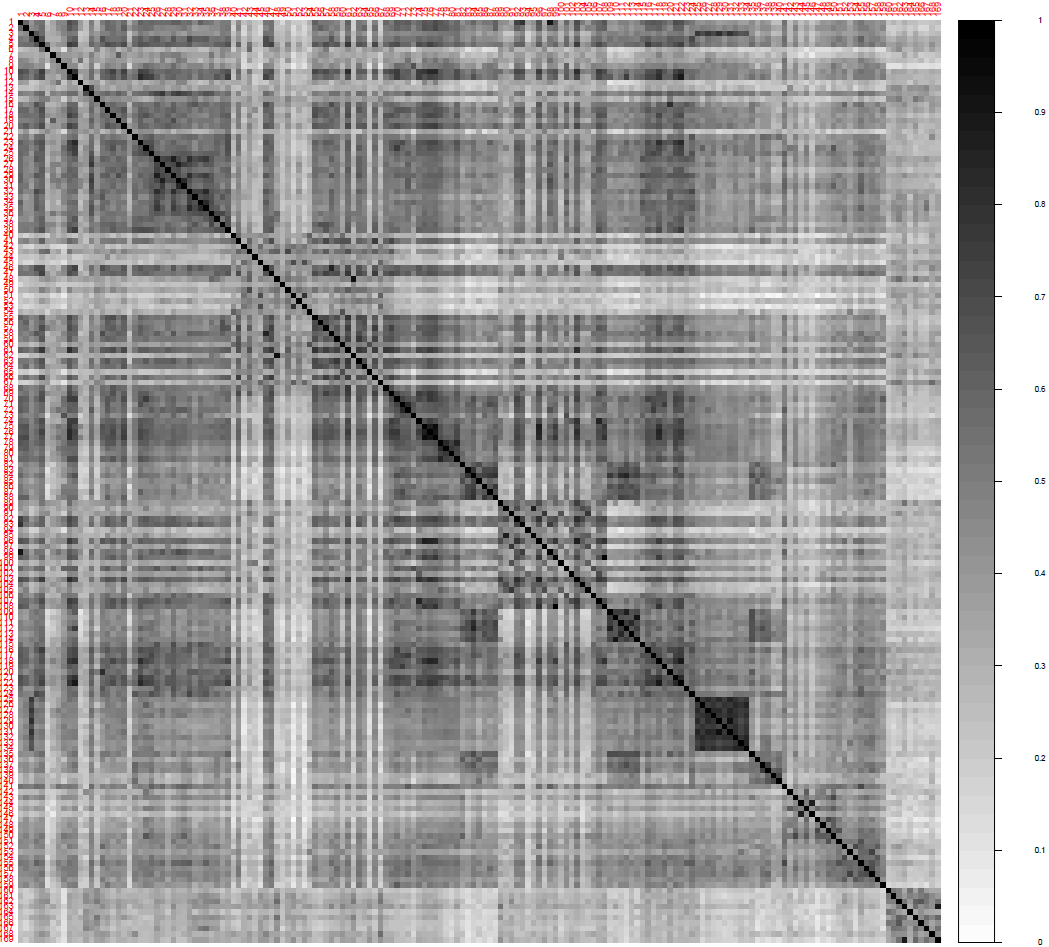
Working with semantic embeddings using LLMs (extracted with OpenAI’s text-embedding-ada-002)
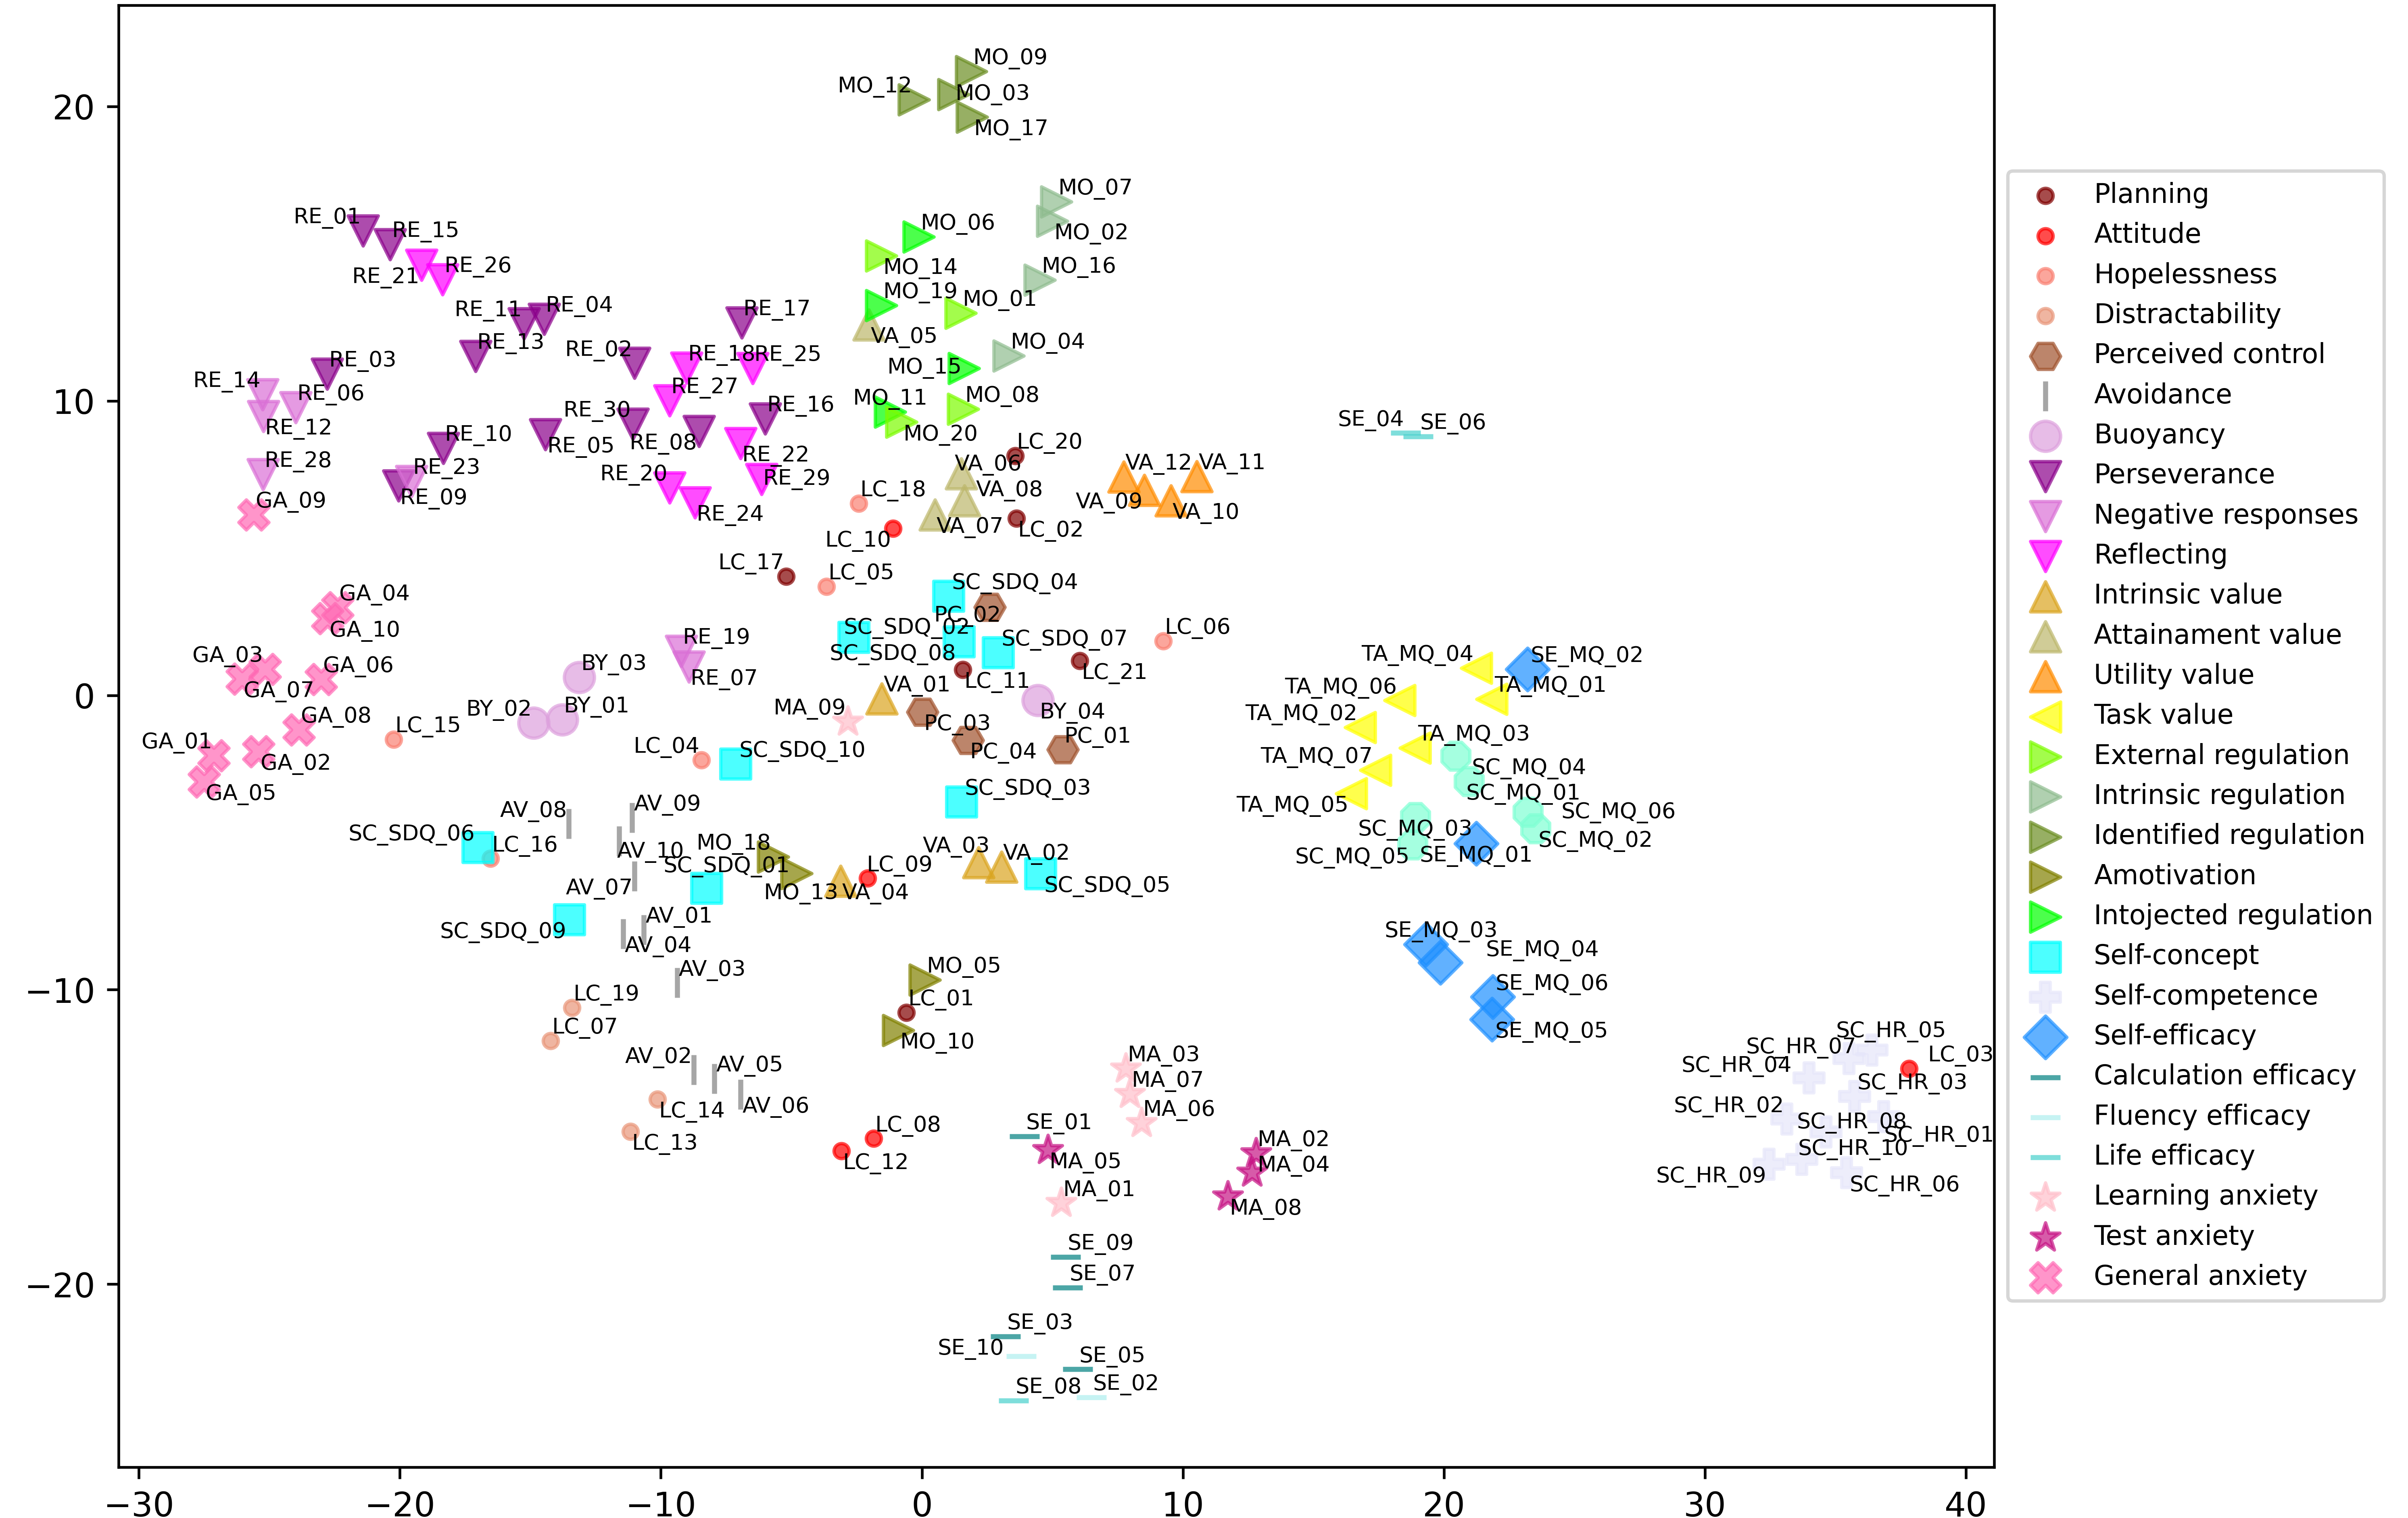
Embeddings + Clustering, An exercise we will see 😉